
Protein Design
Generate protein structures for binding and catalytic tasks.
Task & evaluation
- Objective
- Generate protein backbones for four design settings.
- Input
- Design constraints and, where applicable, a binding target or active site.
- Output
- Generated protein backbones for unconditional, binder and enzyme-design tasks.
- Data
- A curated 51-target RFdiffusion3 benchmark and a dated RCSB development corpus.
- Evaluation
- Designability and pass rates evaluated with LigandMPNN and RoseTTAFold3.
- Research challenge
- Satisfy geometry and interaction constraints while producing foldable designs.
Understanding the task
Invent a protein around a molecular constraint, then test whether a sequence can fold back into the intended design.
Invent a protein that can actually hold its shape
Designing a protein starts with a desired structure or function rather than a known sequence. A ligand-binding task supplies a small molecule but no ready-made pocket. An enzyme task supplies catalytic atoms whose arrangement must be preserved. The surrounding protein still has to be invented.
This environment tests one system across four settings: free generation, small-molecule binding, protein binding and enzyme scaffolding. A plausible drawing is only the beginning. Can a sequence be found that folds back into the proposed design?
Start from a real input: a ligand without a pocket
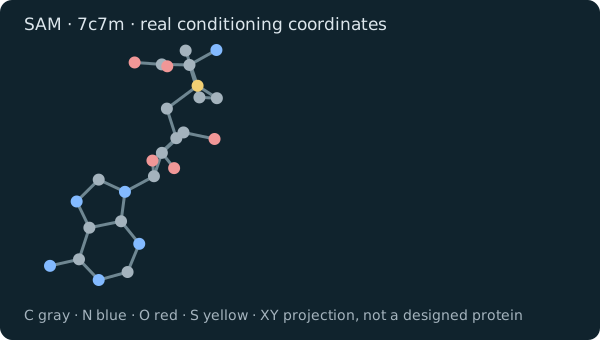
What must be invented?
A 150-residue protein must be generated around the ligand. The pocket geometry and fold are outputs, not templates. Sequence design then asks which amino acids could realize that geometry.
Enzyme scaffolding instead supplies catalytic atoms; protein binding supplies a target surface and hotspots. These are different conditioning problems for one shared system.
Ligand coordinates · PDB-derived coordinates (CC0); RFdiffusion3 benchmark selection.
Inside the generator, outside the measuring instrument
The generator gradually resolves noisy atoms around fixed constraints. A separate folding model then tests whether a sequence can realize the design.
- Condition + noiseMotif, ligand or target atoms held at zero noise; generated atoms perturbed.
- Connect atoms and residuesCombine local atomic detail with information about the wider protein.
- Conditional denoisingRepeatedly refine the surrounding structure while keeping the supplied constraint fixed.
- Generated coordinatesPropose a scaffold that accommodates the fixed molecular geometry.
External assay → 4 inverse-folded sequences → RoseTTAFold3 predictions → track-specific thresholds. A denoising training loss is not the benchmark score.
Build around a constraint, then test the round trip
Interactive 2D schematic. Move the scaffold, then deform its refold: fitting a context and reproducing a fold are different questions. No molecular inference, affinity prediction or benchmark scoring runs here.
1 · Conditional structure
2 · Sequence → refold → compare
LigandMPNN · 4 sequences → RoseTTAFold3
Enzyme: motif all-atom RMSD ≤ 1.5 Å after motif-backbone alignment, plus no non-motif N, CA or C atom within 1.5 Å of a ligand atom in the raw design.
Preserving catalytic geometry does not establish catalytic activity. A matching refold is computational evidence, not a functional experiment.
Report four separate target-averaged pass rates and diversity; no composite score. Missing designs remain failures. A design passes if any of four sequences meets its track rule (enzyme also considers five predictor models per sequence).
A computable score example
Illustrative small-molecule design, not a measured result. Each row is one refolded sequence. All four conditions must pass in the same row.
| Sequence | Backbone RMSD (Å) | Ligand RMSD (Å) | Interface PAE | ipTM | Result |
|---|---|---|---|---|---|
| 1 | 1.2 | 4.0 | 1.2 | 0.79 | Fail: ipTM |
| 2 | 1.6 | 4.0 | 1.2 | 0.85 | Fail: backbone |
| 3 | 1.2 | 5.5 | 1.2 | 0.85 | Fail: ligand |
| 4 | 1.2 | 4.0 | 1.8 | 0.85 | Fail: PAE |
Design fails: none of its four sequences meets all conditions.
For one target requesting 100 designs, suppose 20 already pass and 10 outputs are missing. Adding this design's verdict gives 20 / 100 = 20%. Missing outputs stay in the denominator. Four small-molecule target rates are then averaged; tracks remain separate.
Diversity is a different fraction: if those 20 passing structures form 5 clusters, target diversity is 5 / 20 = 0.25. It is averaged across targets, with zero assigned when none passes. Duplicating a successful fold can raise pass count without adding a new cluster.
Different constraints leave different freedoms
The real ligand displayed above is a useful example: its atomic coordinates are known, but the protein around it is absent. Protein-binding requests instead provide a target surface and important contact sites. Enzyme requests specify a catalytic arrangement that the new scaffold must accommodate.
Evaluation contains 51 targets and requests 100 designs for each. Development structures come from the Protein Data Bank. Some evaluation structures are old enough to have appeared in upstream design-model training, so these results do not establish generalization to entirely unseen structural families.
Example design requests
| Track / count | Input example | Designed length |
|---|---|---|
| Enzyme · 41 | M0024 / 1nzy: six catalytic residues FAHGWD + BCA ligand; selected atoms constrain the motif | 180 residues |
| Small molecule · 4 | SAM from 7c7m: ligand coordinates only; see the real coordinate projection above | 150 residues |
| Protein binder · 5 | Targets include PD-L1 (5o45) and insulin receptor (4zxb), with hotspots | 80 residues |
| Unconditional · 1 | Synthetic request uncond_L100: only a length | 100 residues |
Grow a structure around fixed atoms
The baseline is a compact RFdiffusion3 model with about 12.4 million learned parameters. During training, it receives disturbed coordinates and learns to recover a structure. Supplied ligand, target or catalytic atoms stay fixed while the surrounding atoms are denoised.
This teaches a relationship between a constraint and a compatible scaffold. Keeping catalytic atoms in place is easier than arranging a whole protein that can support them, however. The design must also be realizable by an amino-acid sequence.
Send the design on a round trip
For every proposed structure, an inverse-folding model suggests four sequences that might realize it. A structure predictor folds those sequences, and the resulting structures are compared with the intended design. Different tracks check overall shape, interface placement or catalytic geometry.
Coordinate discrepancies are measured in ångströms, a tenth of a nanometre. Confidence scores also enter some interface rules, but they are not measured binding affinity. Passing this computational assay does not establish binding or catalytic activity in a laboratory.
Each track reports its own pass rate and diversity. Repeating one successful structure may increase the number of passing designs while adding no new fold; diversity reveals that distinction. Missing designs remain failures.
Technical reference
| Track | Pass condition |
|---|---|
| Unconditional | Backbone RMSD ≤ 1.5 Å |
| Small-molecule binder | Backbone RMSD ≤ 1.5 Å; ligand RMSD ≤ 5 Å; interface PAE ≤ 1.5; ipTM ≥ 0.8 |
| Protein binder | Binder backbone RMSD ≤ 2.0 Å; interface min PAE ≤ 1.5 |
| Enzyme | Motif all-atom RMSD ≤ 1.5 Å, plus ligand-clash condition |
Free generation is easier than functional design
The author-reported run passes about 42% of unconditional designs, 6% of enzyme designs, 3% of small-molecule binders and 0.2% of protein binders. The final figure is just one passing protein binder out of 500 requests, making relative improvements easy to overstate.
Enzyme success is also concentrated: 28 of 41 targets have no passing designs. All tracks satisfy the supplied conditioning geometry, showing why obeying a geometric constraint is not enough to survive the sequence-and-fold round trip.
The run was not independently reproduced, and repeated training seeds or matched conditioning ablations are unreported. The local assay uses RoseTTAFold3 rather than the original paper’s AlphaFold evaluation, so the rates are not directly comparable.
| Design task | Pass rate | Diversity score |
|---|---|---|
| Enzyme | 6.2% | 0.34 |
| Small-molecule binder | 2.8% | 0.75 |
| Protein binder | 0.2% | 0.20 |
| Unconditional | 42.0% | 1.00 |
Compute and resources
Training and design assay
Reported measurement
- Time
- 57 h 33 min
- Hardware
- 8 × L40S
- GPU allocation
- ≈460.4 GPU-h
Reported stages for the reference model.
GPU allocation by stage
- Generator training
- 384 GPU-h
- Design assay
- 76.4 GPU-h
Measured training and evaluation only; data preparation is excluded.
Timing and hardware details
Generator training
Reported measurement
- Time
- 48 h
- Hardware
- 8 × L40S
- GPU allocation
- 384 GPU-h
Training from random weights for the same baseline evaluated below.
Training and the full assay together account for about 460.4 GPU-hours; data preparation is not included.
Full design assay
Reported measurement
- Time
- 9 h 33 min
- Hardware
- 8 × L40S
- GPU allocation
- ≈76.4 GPU-h
Evaluation of 51 targets with 100 designs each.
Task-author measurement; it does not measure generator training cost.
Find out whether the model uses the constraint
Compare designs made with the correct target against designs made with a shuffled target. Inspect how success varies across individual enzymes, rather than only averaging them. For binders, check whether the intended contact surface is engaged in addition to the scored thresholds.
These experiments would separate learned conditional design from reuse of a few convenient shapes. Improvements should preserve diversity and use comparable generation and refolding budgets.
References and provenance
De novo Design of All-atom Biomolecular Interactions with RFdiffusion3
Motivates conditional all-atom generation; the Foundry implementation supplies the RFD3 generator and RF3 structure predictor.
LigandMPNN
Provides sequence-design tools that take surrounding molecular context into account.
Task definition and experimental evidence
Describes this task’s smaller generator and computational assay. Passing that assay is not evidence of laboratory validation.
Code links require access to the project’s GitHub repository.
Leaderboard
SimulatedDesign preview · leaderboard values and research histories are simulated.
| # | Method | Type | Design pass rate ↑ | Binder success ↑ | Backbone validity ↑ | Research time | Run |
|---|---|---|---|---|---|---|---|
| 1 | Agent search | 0.6600 | 0.4988 | 0.6600 | 76 h | ||
| 2 | Agent search | 0.6581 | 0.4973 | 0.6581 | 60 h | ||
| 3 | RFdiffusion3 (rfd3-small) | Reference | 0.6550 | 0.4950 | 0.6550 | — | — |
How to read these leaderboard metrics
These leaderboard values and research histories are simulated design examples. The leaderboard is ranked by Design pass rate. The research curves show relative improvement in this metric over RFdiffusion3 (rfd3-small); only accepted new-best results update the retained trajectory. A positive gain means a better result, with the sign adjusted for metrics where lower is better. The task protocol is described in Task & evaluation above. These preview columns and trajectories are not measured benchmark results and must not be compared with the recorded experiments. The leaderboard and agent-search curves are simulated interface examples. Their generic Design pass rate / Binder success / Backbone validity values are not measured rfd3-small results and are not the official scoring protocol. Real evaluation reports four separate target-averaged pass rates and diversity, with no composite reward. See the author-reported results and exact thresholds below.
- Design pass ratePrimary metric · Higher is better
- The fraction of generated designs meeting the task’s acceptance criteria. The task-specific verifier determines which properties are required.
- Binder successHigher is better
- The fraction of binder designs passing the designated evaluation. Computational acceptance should be distinguished from experimental binding validation.
- Backbone validityHigher is better
- The fraction of generated protein backbones satisfying the task’s geometry and structural-validity checks.
AI4AI research progress
Research trajectory
Runtime–performance frontier
How improvement is measured
Relative improvement over RFdiffusion3 (rfd3-small) in the primary metric; only retained results update the best-so-far curve.
Accepted new-best experiments raise the trajectory. The frontier includes evaluated candidates; trial, partial and stopped experiments are excluded.