
Mass Spectrometry Molecule Retrieval
Identify molecular structures from experimental mass spectra.
Task & evaluation
- Objective
- Identify a molecule from its fragmentation pattern.
- Input
- Measured peaks, instrument conditions and candidate structures.
- Output
- A ranking of all supplied candidate molecules.
- Data
- Experimental MassSpecGym spectra, with optional simulated training examples.
- Evaluation
- How often the correct molecule ranks first, or appears in a useful shortlist.
- Research challenge
- Distinguish related structures despite changing instruments and collision conditions.
Understanding the task
See how molecular fragments become clues, and why one small peak can change the best candidate.
Recognizing a molecule from its fragments
Tandem mass spectrometry breaks a molecule into fragments and measures their masses relative to charge. The resulting peaks are clues to the original structure. Strong peaks identify common fragments; a weak peak can distinguish two otherwise similar molecules.
This task gives the model a spectrum and a list of candidate structures. It must rank them, placing the true molecule first. The difficulty is ambiguity: related molecules can fragment similarly, and changing the instrument or collision energy changes the pattern.
A real spectrum, and a real retrieval mistake
Public validation query MassSpecGymID0079471 · 45 measured peaks · QTOF · [M+H]+ · recorded collision energy 20. Three structures are shown from its 256-candidate pool.
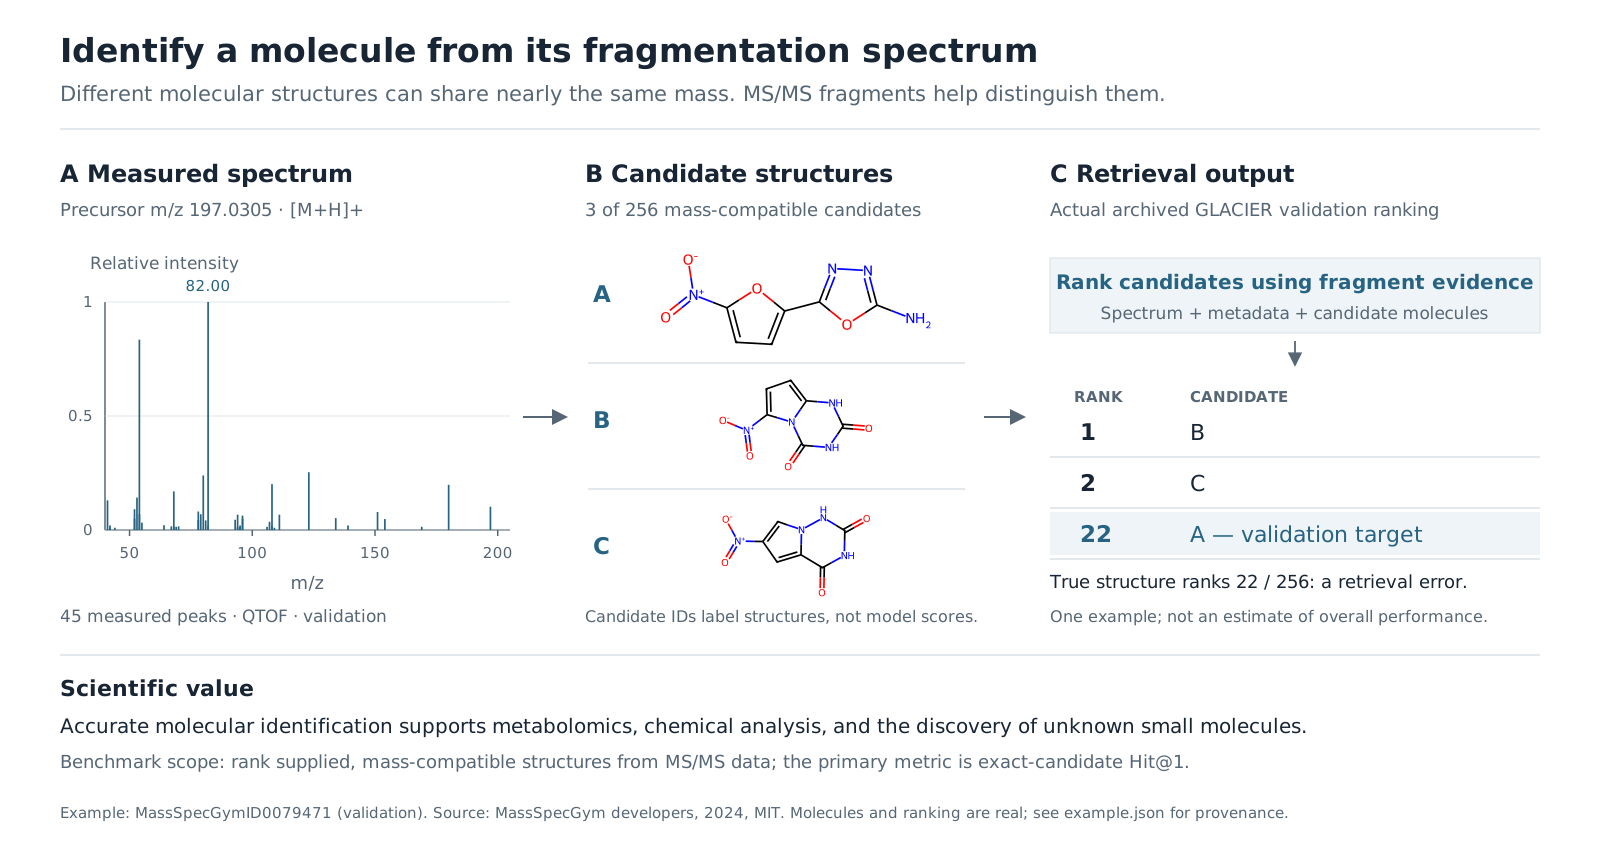
MassSpecGym developers (2024), MIT license. Example data · Source license. This real-data panel is separate from the synthetic interactive experiment below.
Two routes to one complete ranking
Acquisition metadata
Learned graph features
How strong is each peak?
Rank supplied candidates
Fallback path: observed peaks → Fourier-DeepSets → predicted structural features → compare candidate fingerprints → complete ranking. Public acquisition/structure checks choose the route; the true identity is never a routing input.
Train: MAGMa fragment targets + experimental intensities supervise the simulator. Inference: compare every supplied candidate with the observed spectrum. Native model: 15.1M parameters, random initialization. Method and results.
One missing fragment can change the winner
Compare a query with six invented candidate signatures. A is the known answer in this teaching example; B shares its strong peaks. Remove A’s diagnostic peak, then inspect the competing structures.
Observed and candidate peaks
━ Query ┄ Selected candidate
Candidate evidence and ranking
Choose a row to overlay its signature.
Candidate A · diagnostic evidence
A and B share the dominant synthetic peaks. A’s weaker diagnostic peak separates their signatures.
Default: all diagnostic evidence retained.
Here, candidates are ranked by how closely their fragment peaks match the observed spectrum. This simple illustration is not the trained model. In the benchmark, the correct molecule must be found among as many as 256 candidates, and every query counts.
Real spectra, imperfect clues
MassSpecGym provides about 194,000 training spectra, 19,000 validation spectra and 17,556 test queries. A query contains peak positions and intensities plus acquisition information, with up to 256 candidate structures. Intensities describe relative peak strength; they do not directly measure the abundance of molecules across experiments.
The correct formula is not an extra clue. Models must distinguish mass-compatible alternatives using the spectrum and candidates. Training starts without pretrained weights. Optional simulated spectra can broaden chemical coverage, but their patterns may differ from real measurements.
The test set is publicly available, making careful separation from model development especially important. Results measure this known benchmark rather than a newly collected, secret test.
Technical details
| Resource | Count | Role |
|---|---|---|
| Experimental training | 194,119 spectra | Fit model parameters |
| Experimental validation | 19,429 spectra | Select checkpoints and diagnose errors |
| Experimental test | 17,556 queries | Frozen evaluation only |
| MAGMa annotated training | 99,119 of 99,341 eligible | Fragment targets for the native simulator |
| MAGMa annotated validation | 9,720 of 9,734 eligible | Validation only |
| Optional ICEBERG simulations | 2,333,485 | Zero used in the recorded scratch run |
Was the right molecule first?
Hit@1 is the fraction of queries with the correct first choice. Hit@5 and Hit@20 ask whether it appears in a shortlist. A structural-distance metric also describes how chemically different a wrong first answer is.
For an illustrative four-query set with correct ranks 1, 2, 6 and 22, Hit@1 is 25%, Hit@5 is 50% and Hit@20 is 75%. Every query counts equally. The normalized reward rescales first-choice accuracy between two reference systems; it is not the probability that a proposed structure is correct.
Two ways to connect peaks and structures
An inverse model starts with the observed peaks and predicts a molecular fingerprint: a compact description of structural features. It then compares that fingerprint with each candidate. This is the approach used by the simpler DeepSets reference.
GLACIER works in the other direction. It reads a candidate as a graph of atoms and bonds, predicts how it might fragment, and estimates the resulting spectrum. Candidates whose simulated spectra best match the observation rank higher.
The simulator does not support every instrument and molecular input. The reference system therefore uses it where supported and falls back to the inverse model elsewhere. Its overall score measures this complete system, including the difficult cases.
Technical details
| Stage | Recorded setting | Scientific role |
|---|---|---|
| Molecular graph encoder | 5 Graphormer layers; hidden size 256 | Represent atoms, bonds and graph context |
| Fragment decoder | 4 layers; up to 200 breakpoints; up to 6 broken bonds | Propose fragment membership masks |
| Intensity module | 3 encoder + 4 decoder layers | Predict intensity with acquisition conditioning |
| Spectrum representation | 150,000 bins | Compare predicted and observed spectrum |
| Fallback | Fourier-DeepSets → 4,096-bit radius-2 fingerprint | Inverse spectrum-to-molecule representation; rank candidate fingerprints |
Learning which fragments matter
Training annotations associate observed peaks with plausible subsets of the molecule’s atoms. These teach the simulator which fragments can form; measured intensities teach which fragments are prominent under particular acquisition conditions.
But reconstructing a spectrum is not identical to identifying a molecule. A model can reproduce the dominant peaks while missing the small diagnostic peak that separates two candidates. Validation must therefore measure candidate ranking as well as spectral similarity.
Useful shortlists, with room to improve
The from-scratch GLACIER system identifies about 40% of test molecules as its first choice, versus about 4% for the simple reference. It places the answer in the first five about 57% of the time and in the first twenty about 71% of the time.
An official-weight hybrid reaches about 49%, but uses different pretrained components and training history. This is a reference target, not a controlled test of architecture alone. A separate eight-seed reviewer summary reports about 40.5% first-choice accuracy.
| System | Hit@1 | Evidence status |
|---|---|---|
| Fourier-DeepSets | 4.0% | Simple reference |
| From-scratch GLACIER + fallback | 40.3% | Measured result |
| Official-weight GLACIER/MIST | 49.4% | Different pretrained system |
Coverage is a major weakness
The fallback handles about 43% of queries but identifies only about 7% correctly, compared with about 66% on the simulator-supported group. Most of the gap to the official-weight hybrid occurs in that fallback group.
This suggests improving coverage or inverse matching could be valuable. It does not prove that replacing the fallback will recover the entire gap. These test diagnostics describe a fixed system; new design choices should be developed on validation data.
Detailed measurements
| Group | Queries | Scratch + DeepSets | Official-weight hybrid |
|---|---|---|---|
| Native simulator | 9,954 | 65.5415% | 67.4905% |
| Fallback | 7,602 | 7.3007% | 25.6906% |
| All queries | 17,556 | 40.3224% | 49.3905% |
Compute and resources
Hybrid training
Reported measurement
- Time
- ≈5 h 58 min across training stages
- Hardware
- 1 × H200
- GPU allocation
- ≈6 GPU-h
Recorded native training plus its separately trained fallback.
Elapsed time by stage
- Native training
- 20988 s
- Fallback training
- 505 s
Native training used 20,988 seconds; fallback training used 505 seconds.
Full-test prediction
Reported measurement
- Time
- 3.4–3.9 h
- Hardware
- 1 × H100
- GPU allocation
- Not separately reported
A separate timing of all 17,556 queries at batch size 64.
Hardware and batch size affect throughput; this is not the timing of the original test run.
What to try next
Train on confusing candidate pairs, improve acquisition-aware simulation, or combine forward and inverse evidence more effectively. The key test is whether better fragment predictions help distinguish similar structures across the full range of instruments.
References and provenance
MassSpecGym: A benchmark for the discovery and identification of molecules
Introduces the molecular identification benchmark and the measured spectra used to test retrieval.
GLACIER molecular retrieval implementation
Provides the reference implementation used to connect mass spectra with candidate molecular structures.
Task definition and experimental evidence
Documents the unrestricted retrieval protocol and the task-trained model. The real example on this page instead uses an official-weight validation prediction; formula-restricted results are not direct comparisons.
Code links require access to the project’s GitHub repository.
Leaderboard
SimulatedDesign preview · leaderboard values and research histories are simulated.
| # | Method | Type | Retrieval reward ↑ | Hit@1 ↑ | Hit@10 ↑ | Research time | Run |
|---|---|---|---|---|---|---|---|
| 1 | Agent search | 0.6947 | 0.5487 | 0.7098 | 76 h | ||
| 2 | Agent search | 0.6932 | 0.5476 | 0.7083 | 60 h | ||
| 3 | GLACIER / clean-MIST hybrid | Reference | 0.6900 | 0.5450 | 0.7050 | — | — |
| 4 | GLACIER + Fourier-DeepSets (from scratch) | Reference | 0.5658 | 0.4469 | 0.5781 | — | — |
How to read these leaderboard metrics
These leaderboard values and research histories are simulated design examples. The leaderboard is ranked by Retrieval reward. The research curves show relative improvement in this metric over GLACIER / clean-MIST hybrid; only accepted new-best results update the retained trajectory. A positive gain means a better result, with the sign adjusted for metrics where lower is better. The task protocol is described in Task & evaluation above. These preview columns and trajectories are not measured benchmark results and must not be compared with the recorded experiments. The leaderboard below is simulated interface data, not measured submissions. Its illustrative Hit@10 column is not an official task metric. The actual frozen protocol uses Hit@1, Hit@5, Hit@20 and MCES@1; measured reference results and normalized-reward arithmetic appear in the task guide.
- Retrieval rewardPrimary metric · Higher is better
- The task-defined aggregate score for ranking molecular candidates from mass spectra. Hit-rate metrics provide the direct top-ranked retrieval comparison.
- Hit@1Higher is better
- The fraction of queries whose correct candidate is ranked first.
- Hit@10Higher is better
- The fraction of queries whose correct candidate appears among the ten highest-ranked results.
AI4AI research progress
Research trajectory
Runtime–performance frontier
How improvement is measured
Relative improvement over GLACIER / clean-MIST hybrid in the primary metric; only retained results update the best-so-far curve.
Accepted new-best experiments raise the trajectory. The frontier includes evaluated candidates; trial, partial and stopped experiments are excluded.